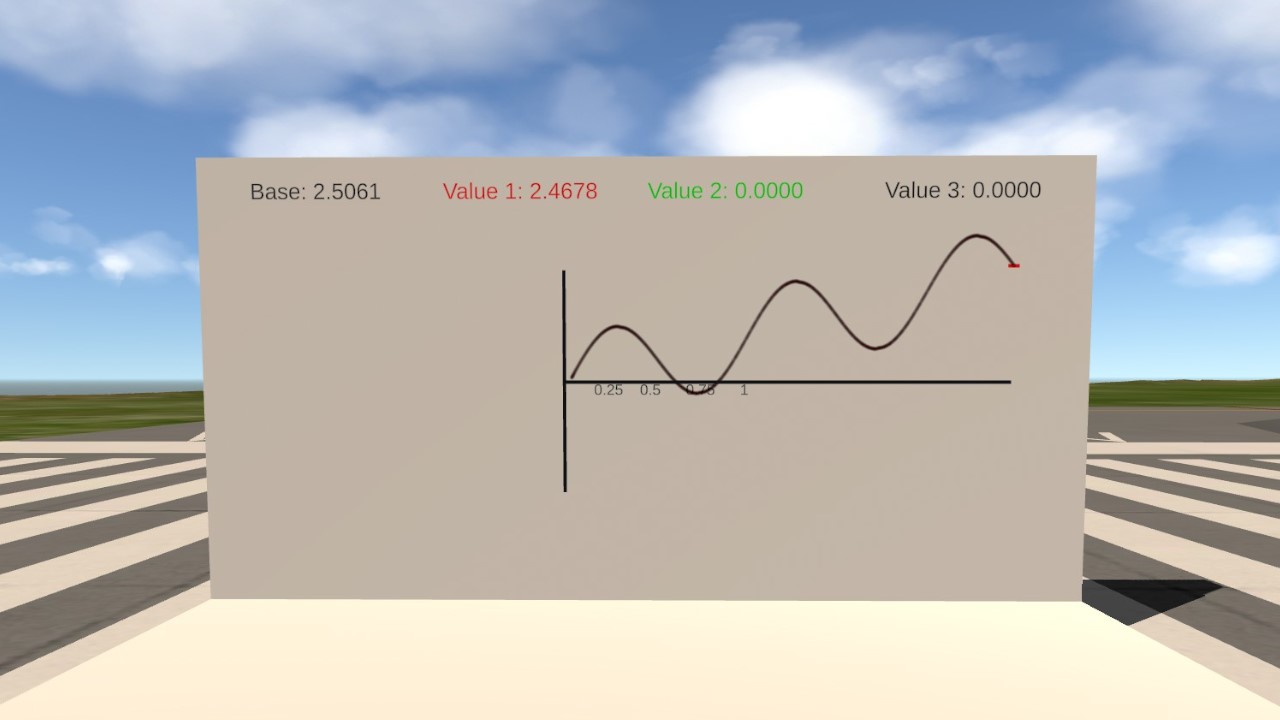
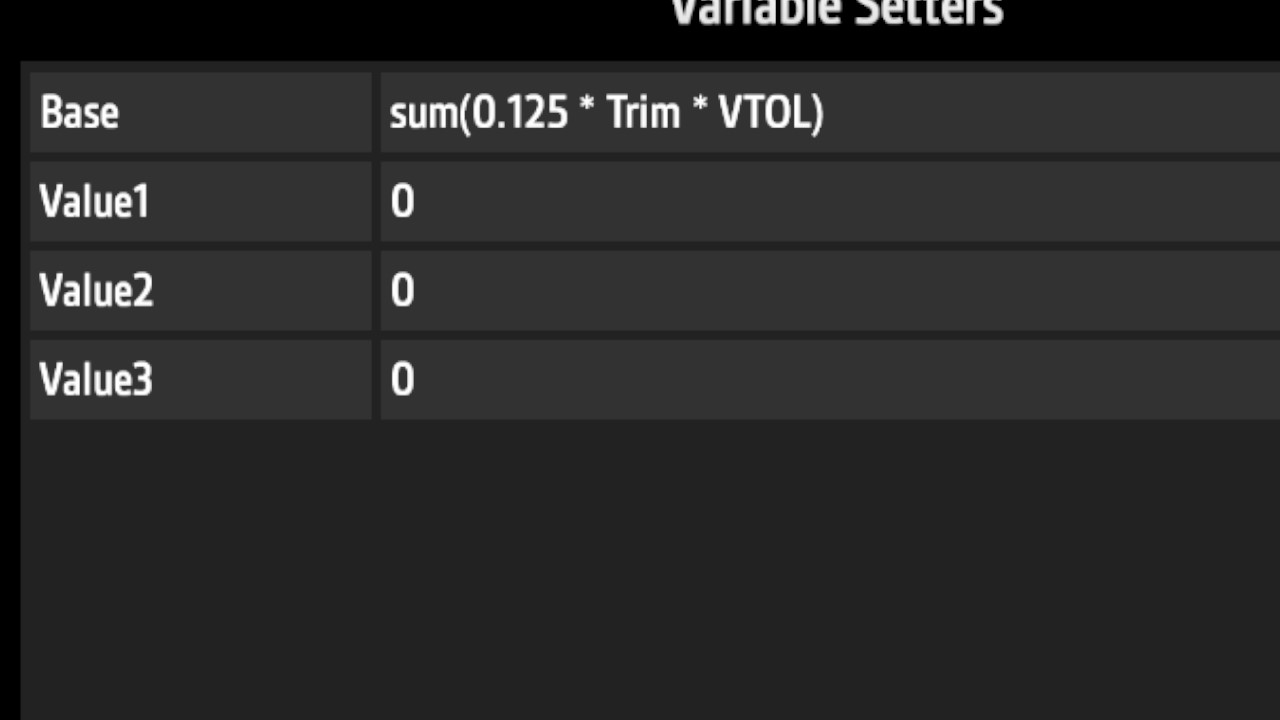
Simple device which can graph up to three equations. To graph an equation, simply write the code in the value of one of three variables, each called "ValueX". Note the pistons for values 2 and 3 are behind the build and need to be nudged forward. Activate 1 for smoke trails to draw the graph. Use Trim and VTOL to control the base value.
The equation in the picture is sin(360 * Base) + Base
Specifications
General Characteristics
- Created On Windows
- Wingspan 32.8ft (10.0m)
- Length 19.8ft (6.0m)
- Height 18.0ft (5.5m)
- Empty Weight 34,526lbs (15,661kg)
- Loaded Weight 34,526lbs (15,661kg)
Performance
- Wing Loading N/A
- Wing Area 0.0ft2 (0.0m2)
- Drag Points 5895
Parts
- Number of Parts 21
- Control Surfaces 0
- Performance Cost 122
Required Mods
-
Smoke Trails
by NathanMikeska
Version 1.0 (9/13/2016 7:40:51 PM)
View Mod Page


@MeuseFlugzeugbau Glad you figured it out. The equation(s) go(es) in the variable setters, in one of the three values.
Hey man, I love this, bit I can't exactly figure out how to work it, where to put the equation, ect. If you can respond it would be much appreciated. you've helped me in the past with my parking breaks so I'd like to say thanks while I'm here :)
EDIT: I figured it out, and I have a half day today so 100% showing my Algebra 1 teacher
@SnoWFLakE0s Cool, thanks. Yeah this could do with some improvements. I just made this in 10 minutes to graph something for school but saw the potential.
Was boutta make... Smh
That being said this could use the features I planned, i.e. dynamic window resizing, bound setting, refresh rate settings etc for a cool data collection device.
Literally putting the CAS to shame @Kenneth